Retroreflector Bee Tracking Components

Here are the 3d design files, PCB files, links to code, etc.

3d model of bee tracking system

Note: these were all made “for my own use”: In particular the 3d models are really awkwardly put together (first time I played with freecad).

The circuit/PCB includes components for:

  • measuring the battery voltages
  • driving the stepper motor (to turn the platform).
  • controlling and triggering the camera/flashes

It is likely most people only want the last of these.

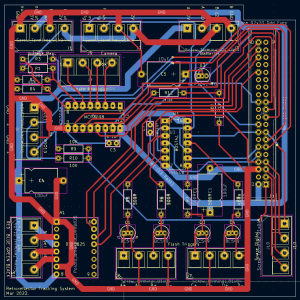
The logic here is that a trigger is sent to the camera. The camera itself has a ‘flash trigger’ it sends back. I then AND this (using a 7408 quad-AND chip) with four flash-selection signals, from the pi. This is because I wanted to control which flashes fired. These then operate 4 transistors which trigger the four flashes.

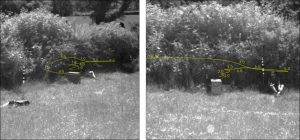
The best way to approach using the tracking idea, is probably to just build your own solution from scratch, using the general principles:

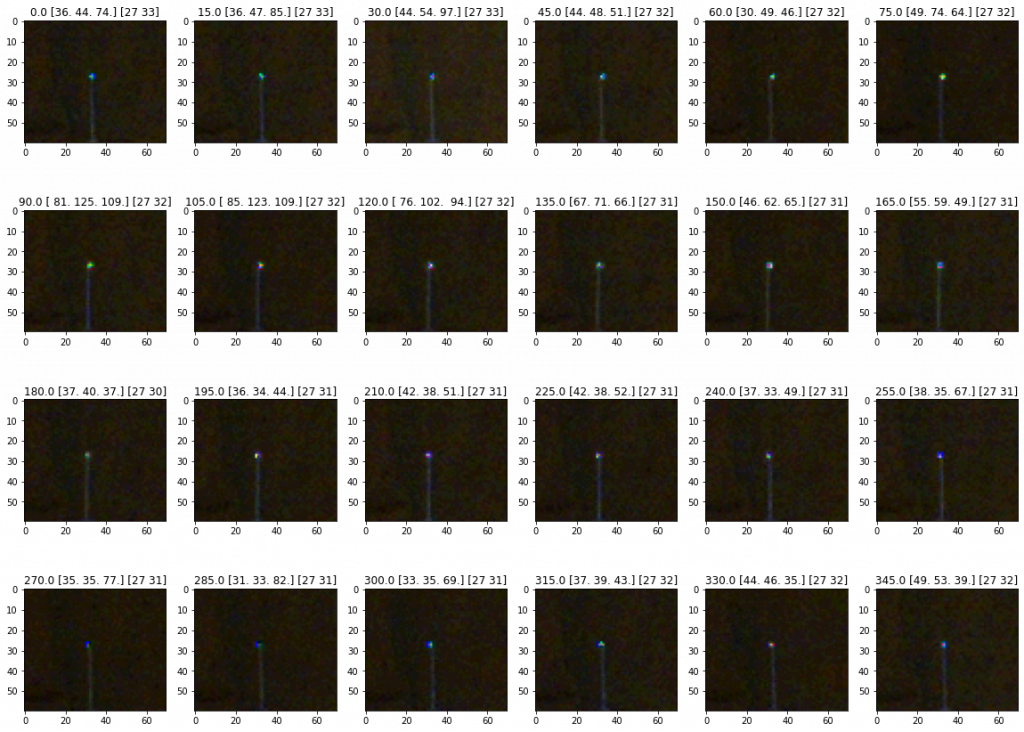
  • A global-electronic shutter, so that you can adjust the exposure to match the flash
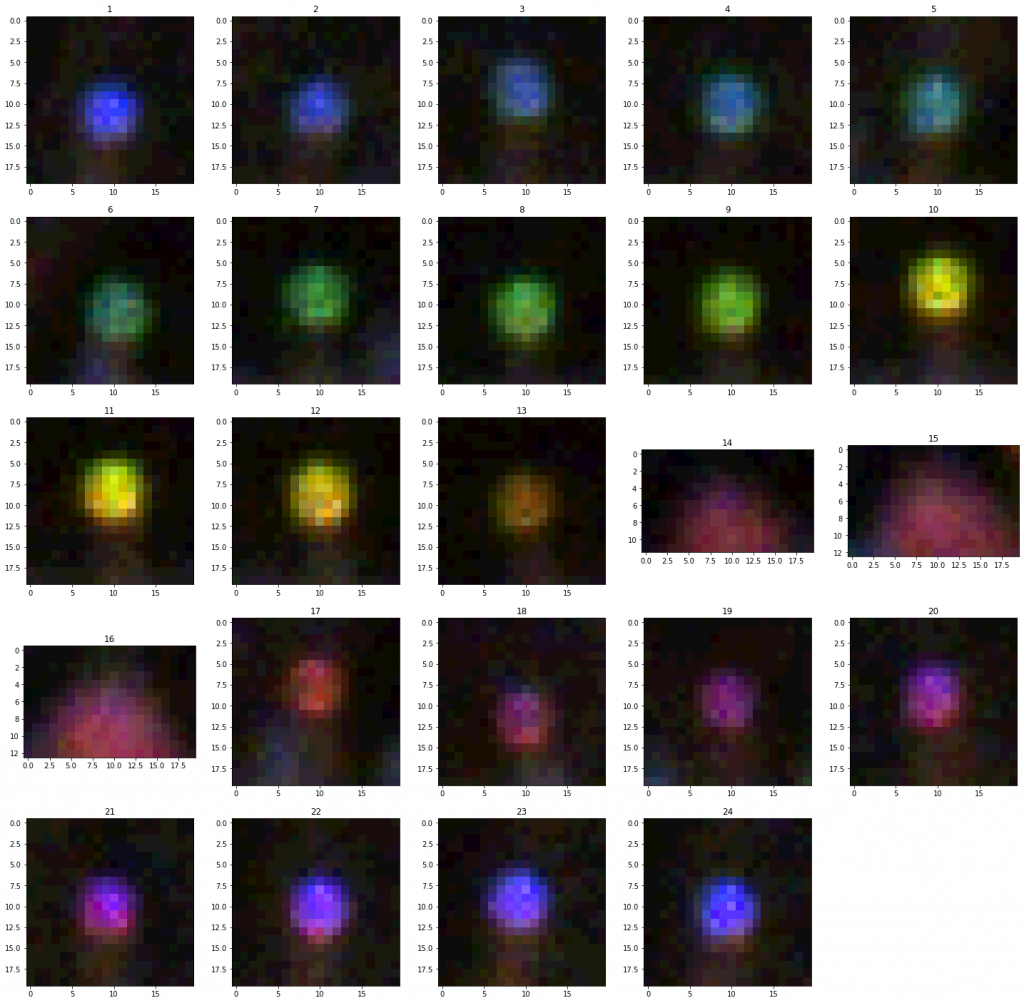
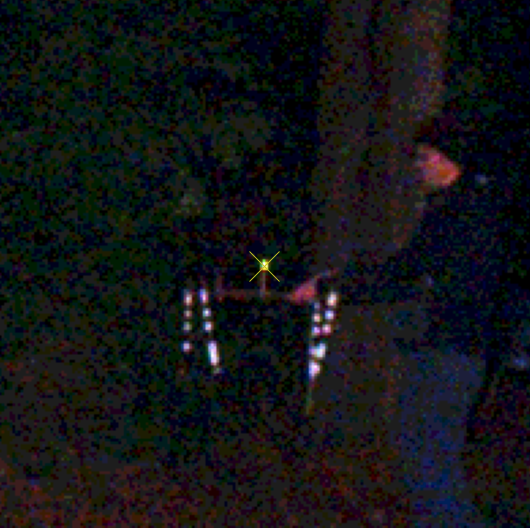
  • Subtracting frames, and then using a bit of logic to try to remove false-positives:
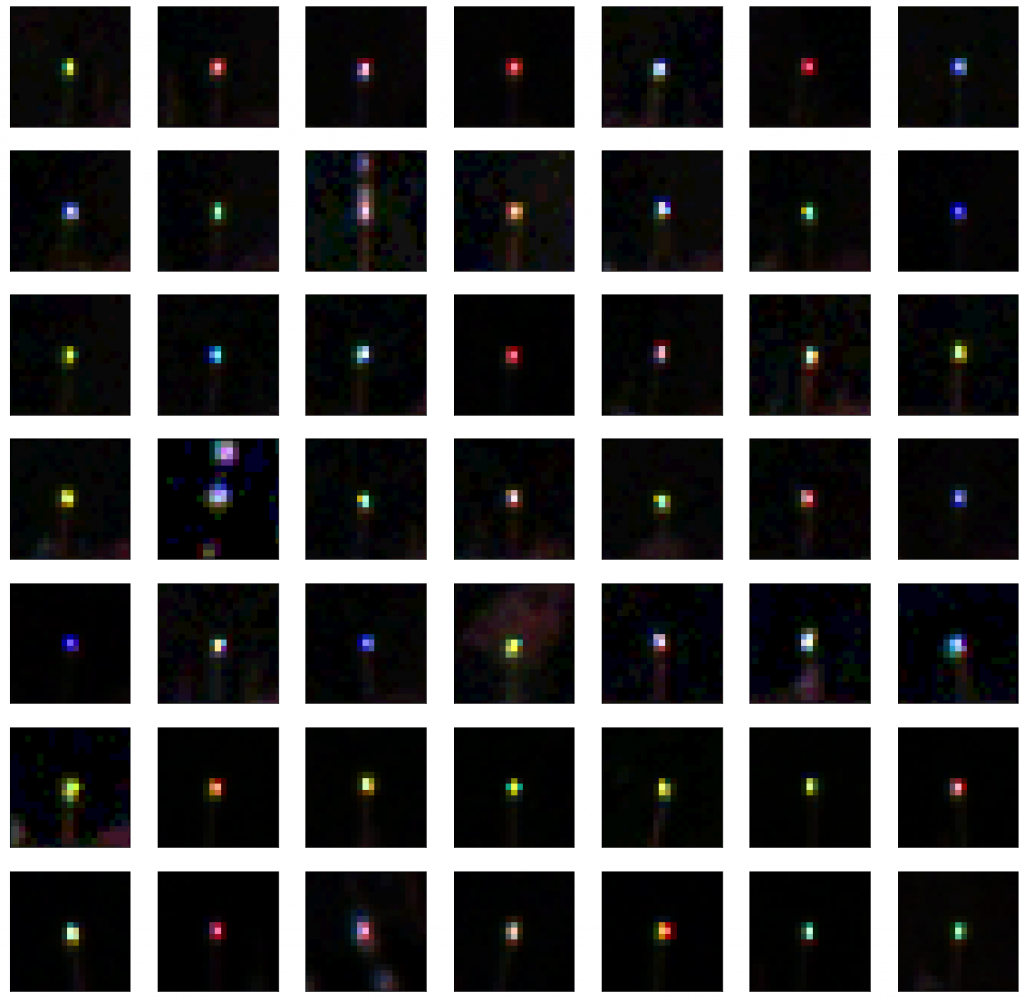
    • Most FPs seem to be ‘blurry’ large blobs (the tags, if the camera is focused are sharp points).

      PCB layout
      PCB layout
    • Consider only considering a true-positive if you have seen a bee in 2-3 images in the same part of the image.
  • Triggering – I use a transistor to do this. I wonder if there are modules that convert from a pi’s GPIO to trigger a flash…

I’m afraid I’ve not looked into raspberry’s new global electronic shutter camera. But this sounds really like a good direction in future: Currently there’s a lot of faff and low reliability around dealing with the cameras I used (the ethernet connection to the camera, the annoying hirose connector, the 12V+ the camera needs etc).

Files:

  • pcb/circuit schematic: link. (created with kicad).
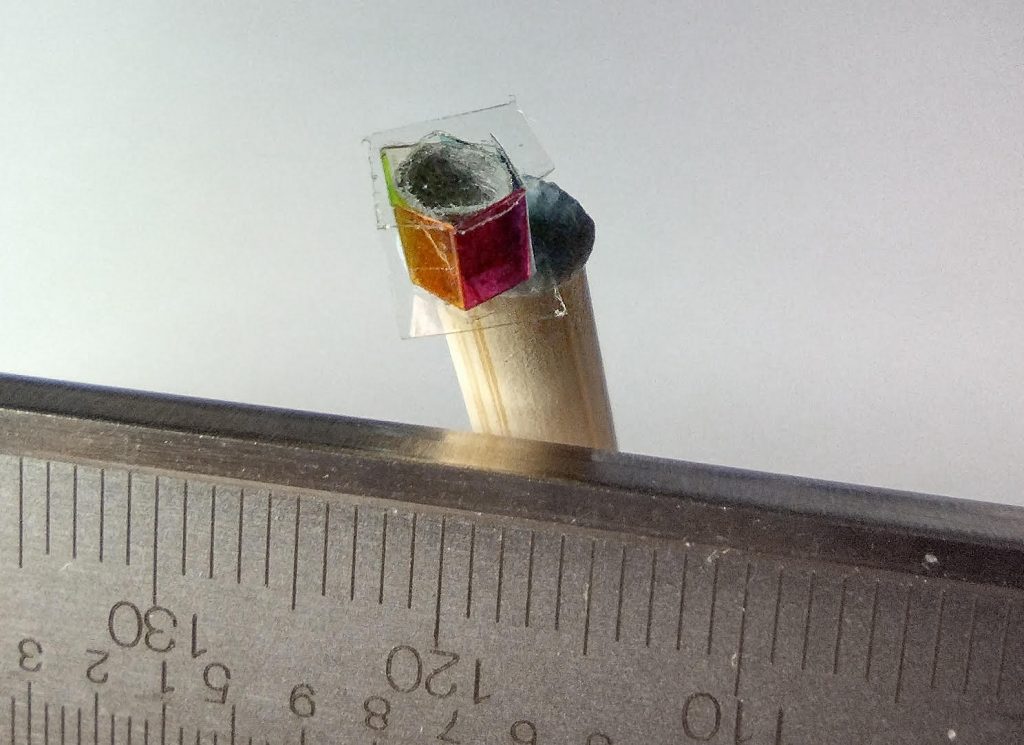
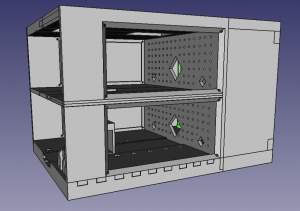
  • 3d model of tracking system: link. (created with freecad).
  • The bee_track python module is on github. See README for install notes. link.
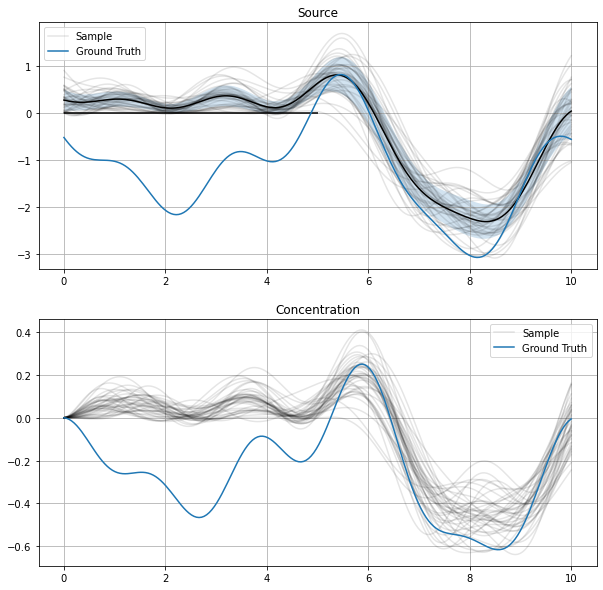


Looking for PhD students!

We’re looking to find PhD students for a variety of insect tracking projects. Funding available!!
Tracking a bumblebee’s learning flight at Exeter university’s field site.
    
Bee Tracking (using retroreflective tags)
I’m working with a few research groups on this, but the main two groups are Natalie Hempel de Ibarra (Exeter) and Andrew Philippides (Sussex), who we’re applying for funding with.
The parts the Sheffield team would be working on are the development of novel methods:
  • 3d flight path reconstruction
  • finding the bee’s orientation using specially devised tags
  • unique labels

The amount of hardware, coding, maths and fieldwork involved can be adjusted depending on what you would find the most interesting! To give a flavour of the maths: We use doubly stochastic variational inference to find the path of the bee. We use a raspberry pi and a custom 3d printed unit to house the tracking system, and a web interface to control it, in the field. [the initial development of the hardware basis for this is described in my earlier paper, but this paper doesn’t cover the stuff we’re working on now].

I’m also working with other groups who are using this tech for other insects (dragonflies etc).

Bee Tracking (using bluetooth)
I’m also about to put together a funding app with a collaborator in electrical engineering: The plan is to track bees (and other central-place foragers) using a bluetooth chip and tiny battery… again this will need a bit of maths etc, to get it working, happy to explain and discuss more :).

Another insect tracking PhD position
Another related, funded PhD position with Michael Mangan is here – feel free to email me, or Dr. Mangan if you have any questions about the role. Michael Mangan is particularly interested in “In-field tracking of fruitflies” – as this is currently not possible and would support a lot of research
 
Summary
If you’re interested in applying for the funding to work on any of these projects, or want to discuss them further, please email me: m.t.smith@sheffield.ac.uk.
  
PS Another research area: Air Pollution
The other large project I’m working on is with collaborators at Manchester (Mauricio Alvarez) and Nottingham (Richard Wilkinson, Chris Lanyon), trying to model the source of air pollution (given a set of sensor measurements and information about the wind, diffusion, etc). This is more maths related than the bee-tracking one. Here’s a link to the first paper we published on the topic. There are different paths a PhD could go down:
  • practical: applying this to larger and more complex datasets [e.g. continent scale particulate pollution etc] – in the future this is particularly important when countries start to try to inventory their fossil CO2 emissions.
  • mathematical: constraining the model (solving the problem of non-identifiability), non-linear modelling, etc.
  • multiple outputs and multiple scales (from street scale to continental scale, etc).
  • developing higher resolution maps of cities (e.g. by combining surface roughness maps with our advection diffusion model).

Getting the blinky example working for the DA14531 using the microvision IDE

I went through the process of installing all the bits mentioned here (had to get a windows laptop in the end to use it).

The instructions on the blinky page might be for the full programmer rather than the “USB” version.

I had the sample problem as here: The demo that comes preloaded worked, but the blinky program didn’t seem to be able to communicate on the UART. I eventually found the answer in this doc:

help from the manual

The instructions on the forum post were close, but I simply had to change the pin from a 6 to a 5 in:

#define UART2_TX_PIN    GPIO_PIN_5

in user_periph_setup.h.

Edit/Addition: Adding serial communication

I wanted to get feedback via the serial port, but it seemed to just output the default message about the address of the device. I eventually found that the serial port could be enabled by modifying line 163 in da1458x_config_basic.h, which I wasn’t expecting as I’m using a da14531. Anyway, replace the line:

#undef CFG_PRINTF

with

#define CFG_PRINTF

simple!

Non-negative Sources in Air Pollution Modelling

Currently working on the question of how to inforce non-negative pollution sources in our model.

Got it solved 😀 Will post the method soon,

In the meantime here’s a plot…

The model has the source constrained to be non-negative between 0 and 5.

Infinite Bases for EQ kernel

I understand that the EQ kernel (and other kernels) can be understood via the kernel trick as an infinite number of (appropriate) bases functions. I’ve not found the actual proof of this online (I’m sure it’s somewhere, but I clearly didn’t know what to search for [edit: Turns out some of it is in the covariance functions chapter in Gaussian Processes for Machine Learning]). It’s straightforward, but I wanted to see it, so I would know what constants etc I needed my bases to have (lengthscale and height).

Without loss of generality (hopefully) I’ve just considered the kernel evaluated between x and 0. This should be fine as the EQ kernel is stationary.

So:

The EQ kernel: k(x,0) = e^{-\frac{x^2}{2l^2}}

We believe that an infinite number of Gaussian bases, \phi_a(x) = \left(\frac{l^2 \pi}{2}\right)^{-\frac{1}{4}}e^{-\frac{(x-a)^2}{l^2}} will produce the EQ kernel.

mathematical derivation/proof (will copy into latex sometime).

For multiple dimensional inputs:

The EQ kernel: k(\mathbf{x},0) = e^{-\sum_i(\frac{x_i}{l_i})^2}

We believe that an infinite number of Gaussian bases, \phi_\mathbf{a}(\mathbf{x}) = \prod{l_i}^{-\frac{1}{2}}\left(\frac{\pi}{2}\right)^{-\frac{D}{4}}e^{-\sum_i (\frac{(x_i-a_i)}{l_i})^2} will produce the EQ kernel.

Problem getting Simplicity Studio connecting to Thunderboard EFR32BG22 [solved!]

Had trouble getting started with Simplicity Studio on Ubuntu 20.04 LTS.

  • Installed JLinkCommander. Bit confusing the command is JLinkExe. Then ran:
    > connect
    > ?
    I then chose “EFR32BG22CXXXF512”
    and chose “S) SWD”
    and speed “4000”
    it seemed to work!
  • Simplicity cannot connect to J-Link via USB. I got the error “Launching myProject’ has encountered a problem. Could not determine GDB version after sending: arm-none-eabi-gdb –version, response”. Useful tip from here:
    – To run arm-none-eabi-gdb I found it in SimplicityStudio_v5/developer/toolchains/gnu_arm/10.3_2021.10/bin.
    – Had the problem described in the link above, but found I just needed to install libncurses5 with: sudo apt-get install libncurses5.

Not the most exciting post! But a useful note to myself 😀

Bayer Filter

One issue I thought might be a problem is that the pixels on a camera don’t really each measure all 3 colours. Instead, they each measure one colour & the colours are then interpolated. This isn’t a problem if the object being photographed spans many pixels, but what if the object is a tiny bright dot, as in our situation.

An example Bayer filter (from wikipedia)

An example photo of “What the ladybird heard”:

Example photo of What the Ladybird Heard cover: The raw data from the camera. The yellow cover of the book doesn’t have much blue, so the blue pixels are darker.

Sadly the problem of the filter seems to be impacting our bee-orientation/id experiment. Here I rotate a tag 360:

The in-focus result (notice the dot colours don’t smoothly transition)

The result is less accurate predictions of orientation:

Points plotted on colour triangle (number = angle in degrees)

If we adjust the focus of the lens so the tag isn’t in focus, the colours are more reliable:

Progression of tag colour as it rotates (in 14-16 a non-tag was found by mistake)

This leads to a more reliable prediction:

Points plotted on colour triangle (number = angle in degrees)

I think the plan now is to:

  1. Collect more data but download raw (without interpolation) – this also saves bandwidth from the camera.
  2. Look at fitting the PSF using this raw data.
  3. Maybe leave the camera just a little out of focus, to ensure all the colours are detected.

Orientation from Colour Tag (initial experiment)

This was an initial experiment I ran back in December, to see if this idea might work.

The problem of using polarising filters

So, one thing I’ve been thinking about is how to get the orientation from the polarising filters from a side view. From above it is easy (although the 180 degree symmetry needs resolving) one just uses two cameras (with 0 and 45 degree polarising filters on) and a flat polarising filter on the back of the bee. From the side it’s more awkward – with a ridge etc…

Using Colours

Anyway, I went back to my original idea of using colours. For this experiment I made a hexagonal ‘tube’ – it’s a little large in this case (about 5mm across, when I think 3mm is probably the limit – I made a smaller one yesterday about 3mm across that also worked). I put inside the glass-bead style retroreflector and cover the ends of the tube (maybe needs strengthening using superglue).

tag.jpg
The 6 colours of the retroreflective tag.

I then used a tracking system to take photos of the unit from 8m away (the longest straight line in my house :).

I think maybe this isn’t as bright as it used to be: the colour camera isn’t quite as sensitive, the filters absorb some light, and the cylindrical shape rather than a ridge means it’s also a bit weaker [although works from all angles], and I used one flash instead of four… but anyway, here’s some of the photos to give an idea…

image.png
The titles are “angle [maxRed maxGreen maxBlue] [Max location]” Ideally I should fit a PSF to the dots taking into account the Bayer filter.

To build it I picked 6 filters using their spectra provided by LEE filters, hoping I’d pick some that would lead to a path that doesn’t have overlaps. I also just picked filters that transmitted the most light. This could be improved I think – as you can see the dots aren’t in a neat circle…

image.png
The location of the 6 filters on the colour triangle

This on the same sort of triangle as above (although flipped and rotated, so the two axes represent normalised colour)… the numbers are roughly (+/- 15) the angle of the tag. The tag was imaged in order (0,15,30…345,0,15…) and the lines join sequential measurements. Currently we are just using the average value for each colour in a square around the tag, but in future this could be improved.

image.png
The colours on the colour triangle (numbers are the angle of the tag)

We can fit a Gaussian process (or other regressor to this)…

image.png
Contours numbers indicate predicted angle of tag. Dots are training data.

Cross Validation Results

image.png
Leave one out cross validation

MAE = 31 degrees
RMSE = 48 degrees
(chance level is: MAE 90, RMSE 104).

You can see that there’s two directions that seem to look similar (-30 & 150 degrees) where it gets a bit confused. One can see why in the colour map plots (where the dots around 330ish and 150ish are a bit jumbled together – you might even be able to tell by eye looking at the initial photos in the second figure).

Tweaking the choice of colours should help, also taking more close together training points, rather than asking it to interpolate over 15 degree steps.
Note also the actual angle of the tag was only accurate to +/- 15 degrees.
Anyway – this colour-tag idea is another potential approach, instead of the polarising filters.

I only spent a couple of hours or so getting this together, so hopefully I can make a lot of improvements on this in the new year.

Orientation from Tag Colour

My first outdoor experiment with the ‘colour to get orientation’ project looks like its got promising results, but I need to auto-detect the ‘posts’ to get the ground-truth orientation. I might have to come up with a better idea and try again.

Collecting data (using a frame with some coded columns of paper attached) -> The idea is I can get the ground truth orientation.

The following figure shows that it does seem like the colour changes (these are zoomed in on each of the tags in the first 49 flash photos). The first lot are 24m away, then the later dozen are from 16m away.

Reassuringly colourful. (Note: There are a couple that weren’t of the reflector). Most from 24m. The last few were from 16m.

The puzzle is to get the ground truth orientation from the black-and-white sticks and then see if the colours relate to the orientation.