
The IPCC’s SR15 report a couple of years ago is a useful summary of why we should really avoid going above a 1.5C increase, and gives ballpark budgets for how much CO2 we can still emit. I guess sea level rise, the arctic melting and tipping points like the Amazon become savanna are all a worry, but the main ‘output’ that I’ve worried about from when I first heard about climate change was the impact on crop yield. I’m a complete non-expert, but I imagine this typically will appear not as a gradual reduction in yield but in one or two year large scale crop failures. When this happens in more than one part of the world at once the price of food will go up.
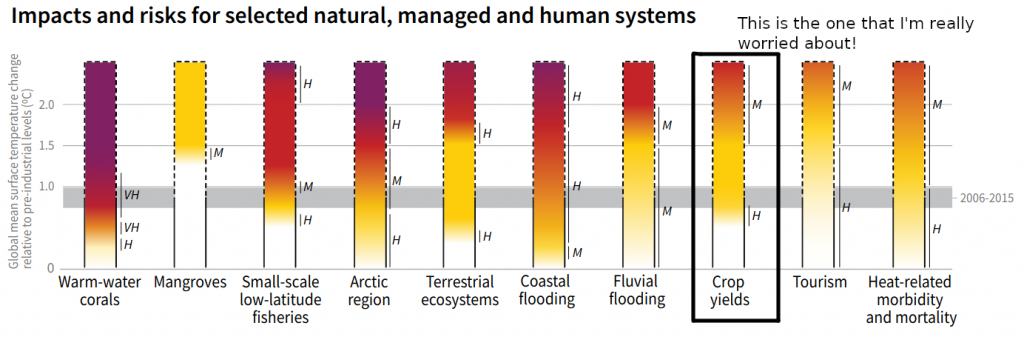
widespread impacts/risks. M = medium confidence level in transition of risk.
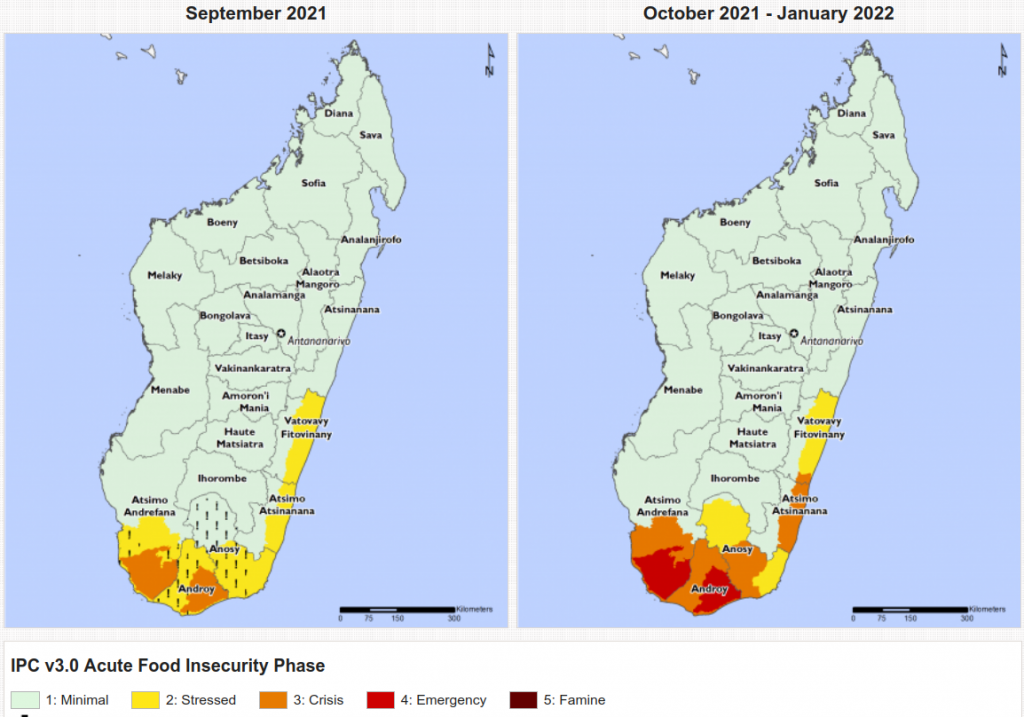
See the 2010-2012 world food price crisis. Or today: Madagascar.
So how much CO2 can we still produce and stand a good chance of avoiding going into the orangey-red bit of the crop-yield plot? Chapter 2 of the report has this table (I’ve cropped it to fit on the post – see p108 of chapter 2 of the SR15 report).
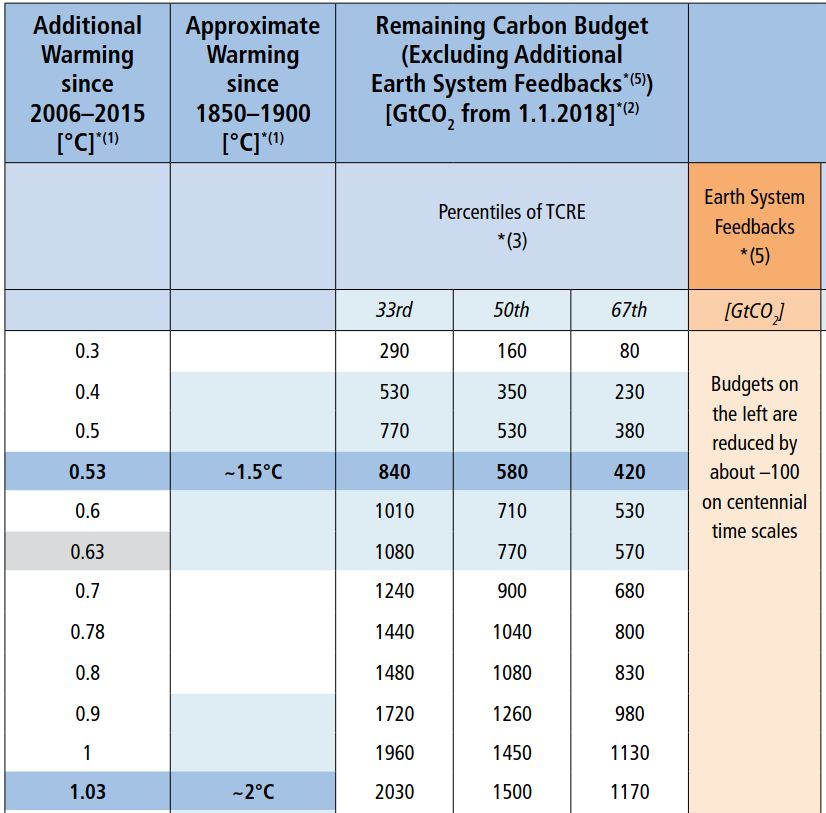
It looks like things to get bad quite quickly after 1.5C. A 50/50 chance of avoiding going past that (and if we care about our grandchildren) gives us a budget of 480GtCO2, but that was 4 years ago nearly. We produced about 40GtCO2 in each of those years so I guess we’re now at 320GtCO2.
So we can continue to emit at this rate for 8 more years (then no emissions).
What are the sources in the UK?
To summarise the UK government’s report on this:
Motor vehicles: 27%
Electricity generation: 21%
Heating houses + cooking: 15%
Business: 17%
Agriculture: 10% [methane from cows is half of this + NOx]
Waste management (mostly methane from landfill): 4%
Industrial processes: 2%
Heating public sector buildings: 2%
Landuse: 1%
(rounding means this adds up to 99%).
(total: 5.4 tonnes/person)
(not included!):
intl aviation: 37MTCO2e (8.5%)
intl shipping: 7.5MTCO2e (1.7%)
(0.66 tonnes/person)
The UK’s electricity: Sources and Uses
From this report for 2020:
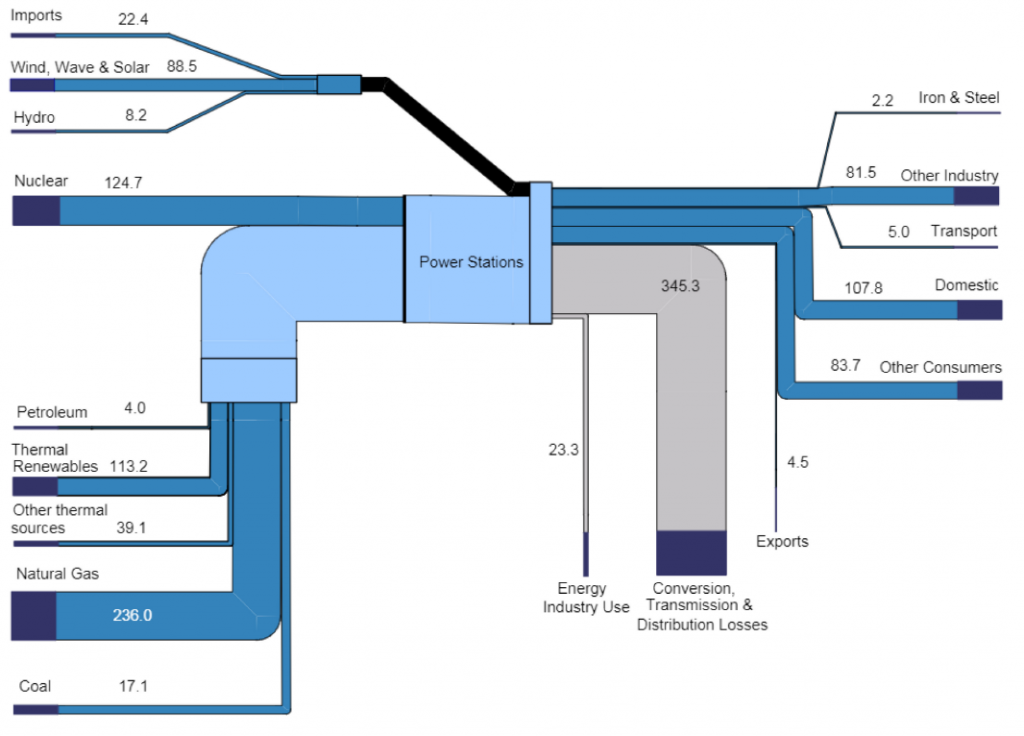
So wind, wave and solar made 88.5TWh. In 2019 we used a total of 1651TWh (source). Obviously renewables can include burning plants and rubbish (113TWh in the diagram above, and 10% of petrol is now bioethanol and some people have woodburners). But I guess my worry is it feels like we’re a long way from powering our heating and our cars from renewables. 5% of our energy was produced by wind, wave and solar.
Post 2100
My last thought I’ve run out of time to write is that I think we need to aim beyond 2100. My children’s children will be middle-aged in 2100.