
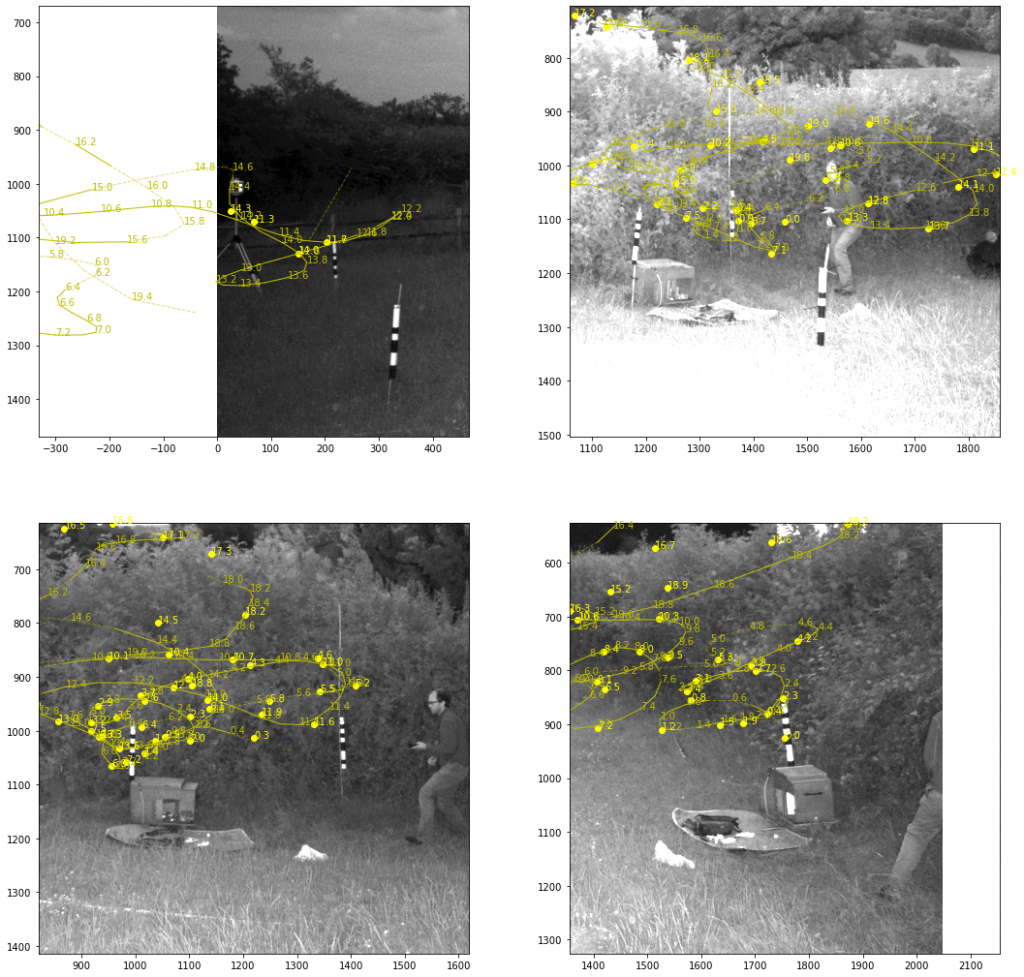
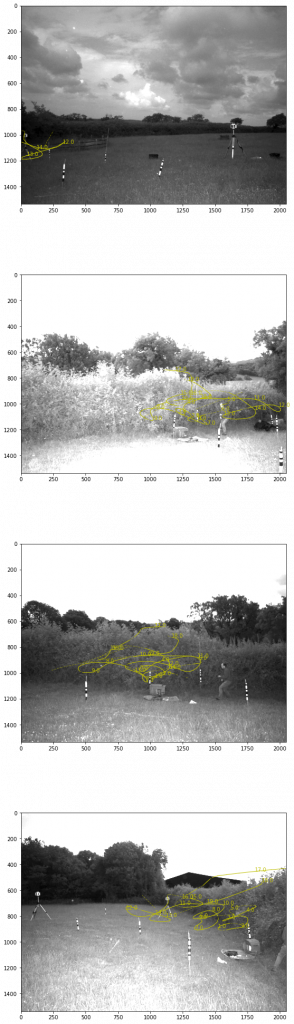
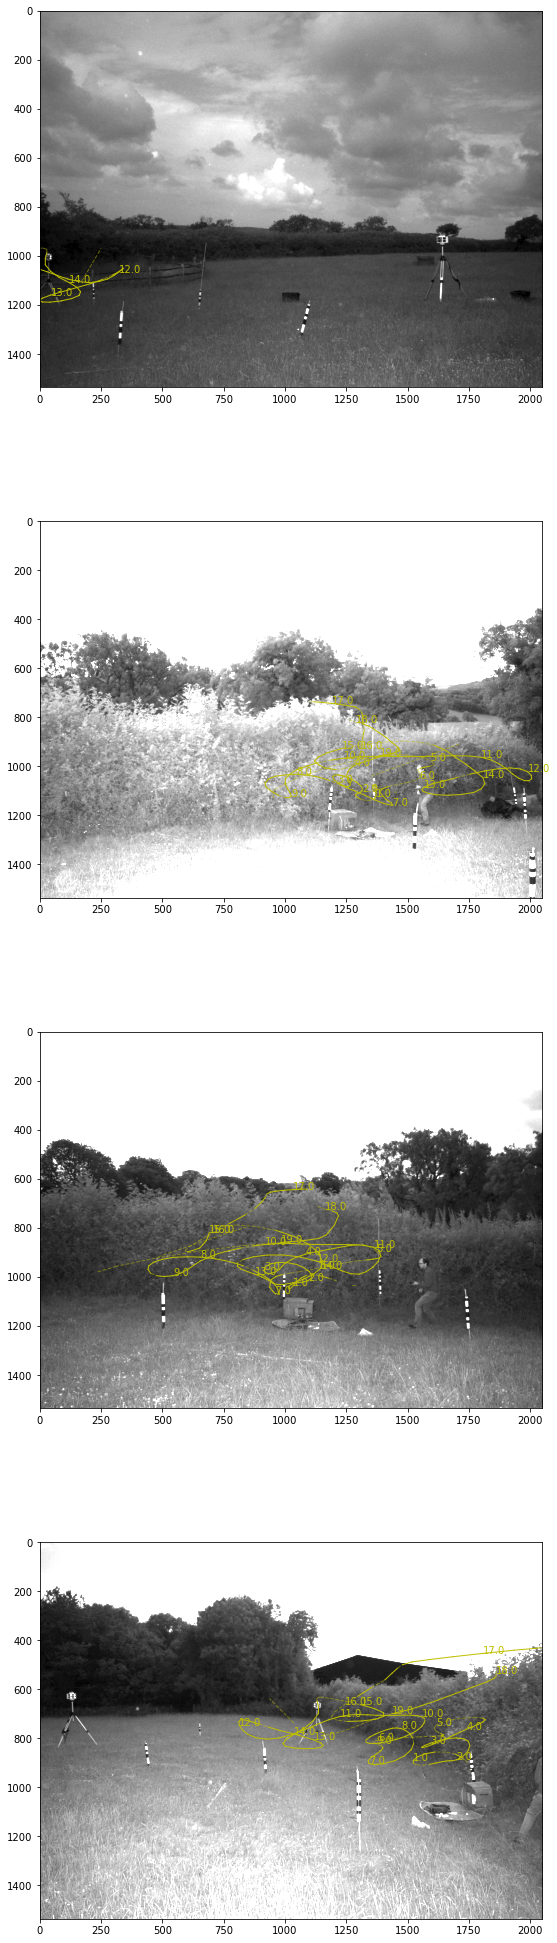
I applied the Gaussian process approach to the first learning flight recorded from the new nest. Unfortunately two of the four cameras weren’t very useful (one pointed the wrong way! and the other had a battery failure), so the path is more uncertain than I would like.
(First ten seconds of the trajectory. Small moving dots are samples from the posterior distribution to give an idea of uncertainty. Similarly the shade of the line indicates uncertainty with white/hidden = a standard deviation of more than 50cm in the prediction). Big dots are the posts and nest. The triangles are the camera locations.
Next I’ll look at other learning flights and start doing some cross validation on the predicted flight path trajectory.
.